Eurovision song contest dataset

I’m teaching hierarchical clustering in my course on DataCamp, and I needed an interesting dataset. Importantly, I wanted the dataset to have labelled instances, so that the dendrogram would be easily interpretable, but also not too many instances, so they all fit on the dendrogram. Fortunately for me, the Eurovision song contest has been publishing the voting results (which is great!) and these are perfect. Both the voting results from the judges, and those from the public give great results. The only thing you need to adjust for is that countries are not allowed to vote for themselves in Eurovision, and this gives you some missing values in the data. I filled these with the maximum score of 12, since it is reasonable to assume that countries would vote selfishly if they were allowed to. Below is the dendrogram of a hierarchical (agglomerative) clustering using complete linkage.

A better version

It occurs to me now that I should have normalised the rows after filling in the missing values. This does indeed improve the hierarchical clustering further.

Wine dataset demonstrates importance of feature scaling

The UCI hosts a dataset of wine measurements that is fantastic for demonstrating the importance of feature scaling in unsupervised learning . There are a bunch of real-valued measurements (of e.g. chemical composition) for three varieties of wine: Barolo, Grignolino and Barbera. I am using this dataset to introduce feature scaling my course on DataCamp.

The wine measurements have very different scales, and performing a k-means clustering (with 3 clusters) on the unscaled measurements yields clusters that don’t correspond to the varieties:

varieties  Barbera  Barolo  Grignolino
labels                                
0               29      13          20
1                0      46           1
2               19       0          50

However, if the measurements are first standardised, the clusters correspond almost perfectly to the three wine varieties:

varieties  Barbera  Barolo  Grignolino
labels                                
0                0      59           3
1               48       0           3
2                0       0          65

Of course, k-means clustering is not meant to be a classifier! But when the clusters do correspond so well to the classes, then it is apparent that the scaling is pretty good.

Which wine varieties?

I had to search to find the names of the wine varieties. According to page 9 of “Chemometrics with R” (Ron Wehrens), the three varieties are: Barolo (58 samples), Grignolino (71 samples) and Barbera (48 samples). I was unable to follow Wehren’s citation (it’s his [6]) on Google books.

Original source

According to the UCI page, this dataset originated from the paper V-PARVUS. An Extendible Pachage of programs for esplorative data analysis, classification and regression analysis by Forina, M., Lanteri, S. Armanino, C., Casolino, C., Casale, M., Oliveri, P.

Olive oil dataset

There is a dataset of olive oil measurements associated to the same paper. I haven’t tried using it, but am sure I’ll use it in an example one day.

An LCD digit dataset for illustrating the “parts-based” representation of NMF

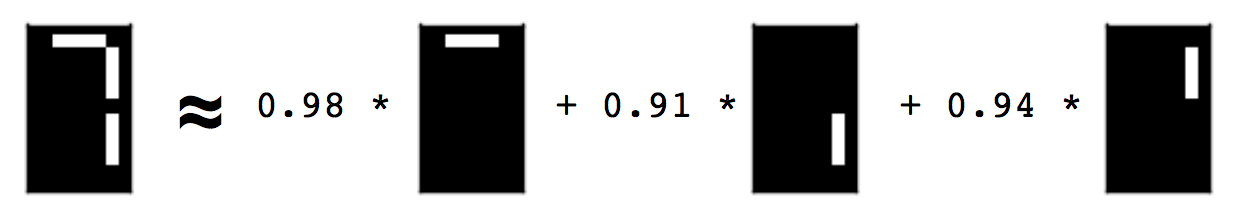
Non-negative matrix factorisation (NMF) learns to reconstruct samples as a superposition of their constituent parts. In the paper of Lee and Seung (1999) that popularised NMF, this is called a “parts-based” representation. This is illustrated in that paper by applying NMF to encodings of images of faces, where NMF seems to decompose the faces into a collage of eigen-eyebrows and eigen-noses. Visual demonstrations are fantastic for conveying ideas, but in this particular instance, the clarity is compromised by the inherent noisiness of real-world facial images. The images are drawn, moreover, from the CBCL dataset, which has a non-commercial license. In order to get around this problem, and to have an even clearer visual demonstration of the “parts-based” decomposition provided by NMF for my course at DataCamp, I created a synthetic image dataset, where each image is of a single digit of a LCD display, as on a clock radio. The parts learned by NMF are then the individual “cells” of the LCD display.

You can construct this dataset yourself, using the code below. The collection of images is encoded as a 2d array of non-negative values. Each row corresponds to an image, and each column corresponds to a pixel. The non-negative entries represent the whiteness of the pixel, encoded here as a value between 0 and 1.

Alternatives

  • The standard bars provide a similar (but more apparently synthetic) image dataset for learning the parts of images. See, for example, the references given in Spratling (1996).
  • Another great visual dataset could be built from black-and-white images of the 52 playing cards in a deck. NMF would then learn the ranks (i.e. ace, 2, 3, …, ) and the suits (i.e. spades, hearts, …) as parts, and reconstruct playing cards from these. I haven’t done this.
  • Yet another great example dataset could be constructed using images of a piano keyboard, or perhaps just an octave range, colouring the keys according to how often they are pressed during a song. NMF should then be able to learn the chords as parts. The midi files to construct this dataset could be obtained from the Mutopia project, for example. I haven’t done this either.